量化交易,零零散散接触有几年了,但从来没有系统玩过量化,总之就是很后悔emm
数据接口的选择
网上大多是基于tushare库的教程,但tushare库现在似乎要付费了,不适合用来摸索学习,所以我选择
1
| pip install baostock -i https://pypi.tuna.tsinghua.edu.cn/simple/ --trusted-host pypi.tuna.tsinghua.edu.cn
|
这里使用了清华的国内镜像源,速度很快
baostock提取数据会返回DataFrame类型,所以要记得导入Pandas
尝试写一个小工具
获取某只股票历史K线数据并且格式化是做很多分析的基础,所以先来模仿编写并优化这样一个小工具试一试 才不是因为有现成的代码可以使用面向搜索引擎的Ctrl+C语言呢
连接API
写注释是一个极好的习惯,虽然这里的注释是我Ctrl+C来的
1
2
3
4
5
6
7
8
| import baostock as bs
import pandas as pd
lg = bs.login()
print('login respond error_code:'+lg.error_code)
print('login respond error_msg:'+lg.error_msg)
|
这一部分以后会经常用到了
获取用户参数
1
2
3
4
5
6
|
user_code=input(['请输入股票代码:'])
user_startdate=input(['请输入开始日期YYYY-MM-DD'])
user_enddate=input(['请输入结束日期YYYY-MM-DD'])
user_frequency=input(['请输入 d=日k线、w=周、m=月、5=5分钟、15=15分钟、30=30分钟、60=60分钟k线数据'])
user_adjustflag=input(['请输入 复权类型 1后复权 2前复权 3不复权'])
|
这里我提示信息写的比较详细,就没有考虑输入乱七八糟东西的情况了
获取数据
1
2
3
4
5
6
7
|
rs = bs.query_history_k_data_plus(user_code,
"date,code,open,high,low,close,preclose,volume,amount,adjustflag,turn,tradestatus,pctChg,peTTM,pbMRQ,psTTM,pcfNcfTTM,isST",
start_date=user_startdate, end_date=user_enddate,
frequency=user_frequency, adjustflag=user_adjustflag)
print('query_history_k_data_plus respond error_code:'+rs.error_code)
print('query_history_k_data_plus respond error_msg:'+rs.error_msg)
|
打印结果与输出CSV
1
2
3
4
5
6
7
8
9
10
11
|
data_list = []
while (rs.error_code == '0') & rs.next():
data_list.append(rs.get_row_data())
result = pd.DataFrame(data_list, columns=rs.fields)
outlist=str('D:/'+user_code+'k线数据.csv')
result.to_csv(outlist, encoding="gbk", index=False)
print(result)
|
最后记得
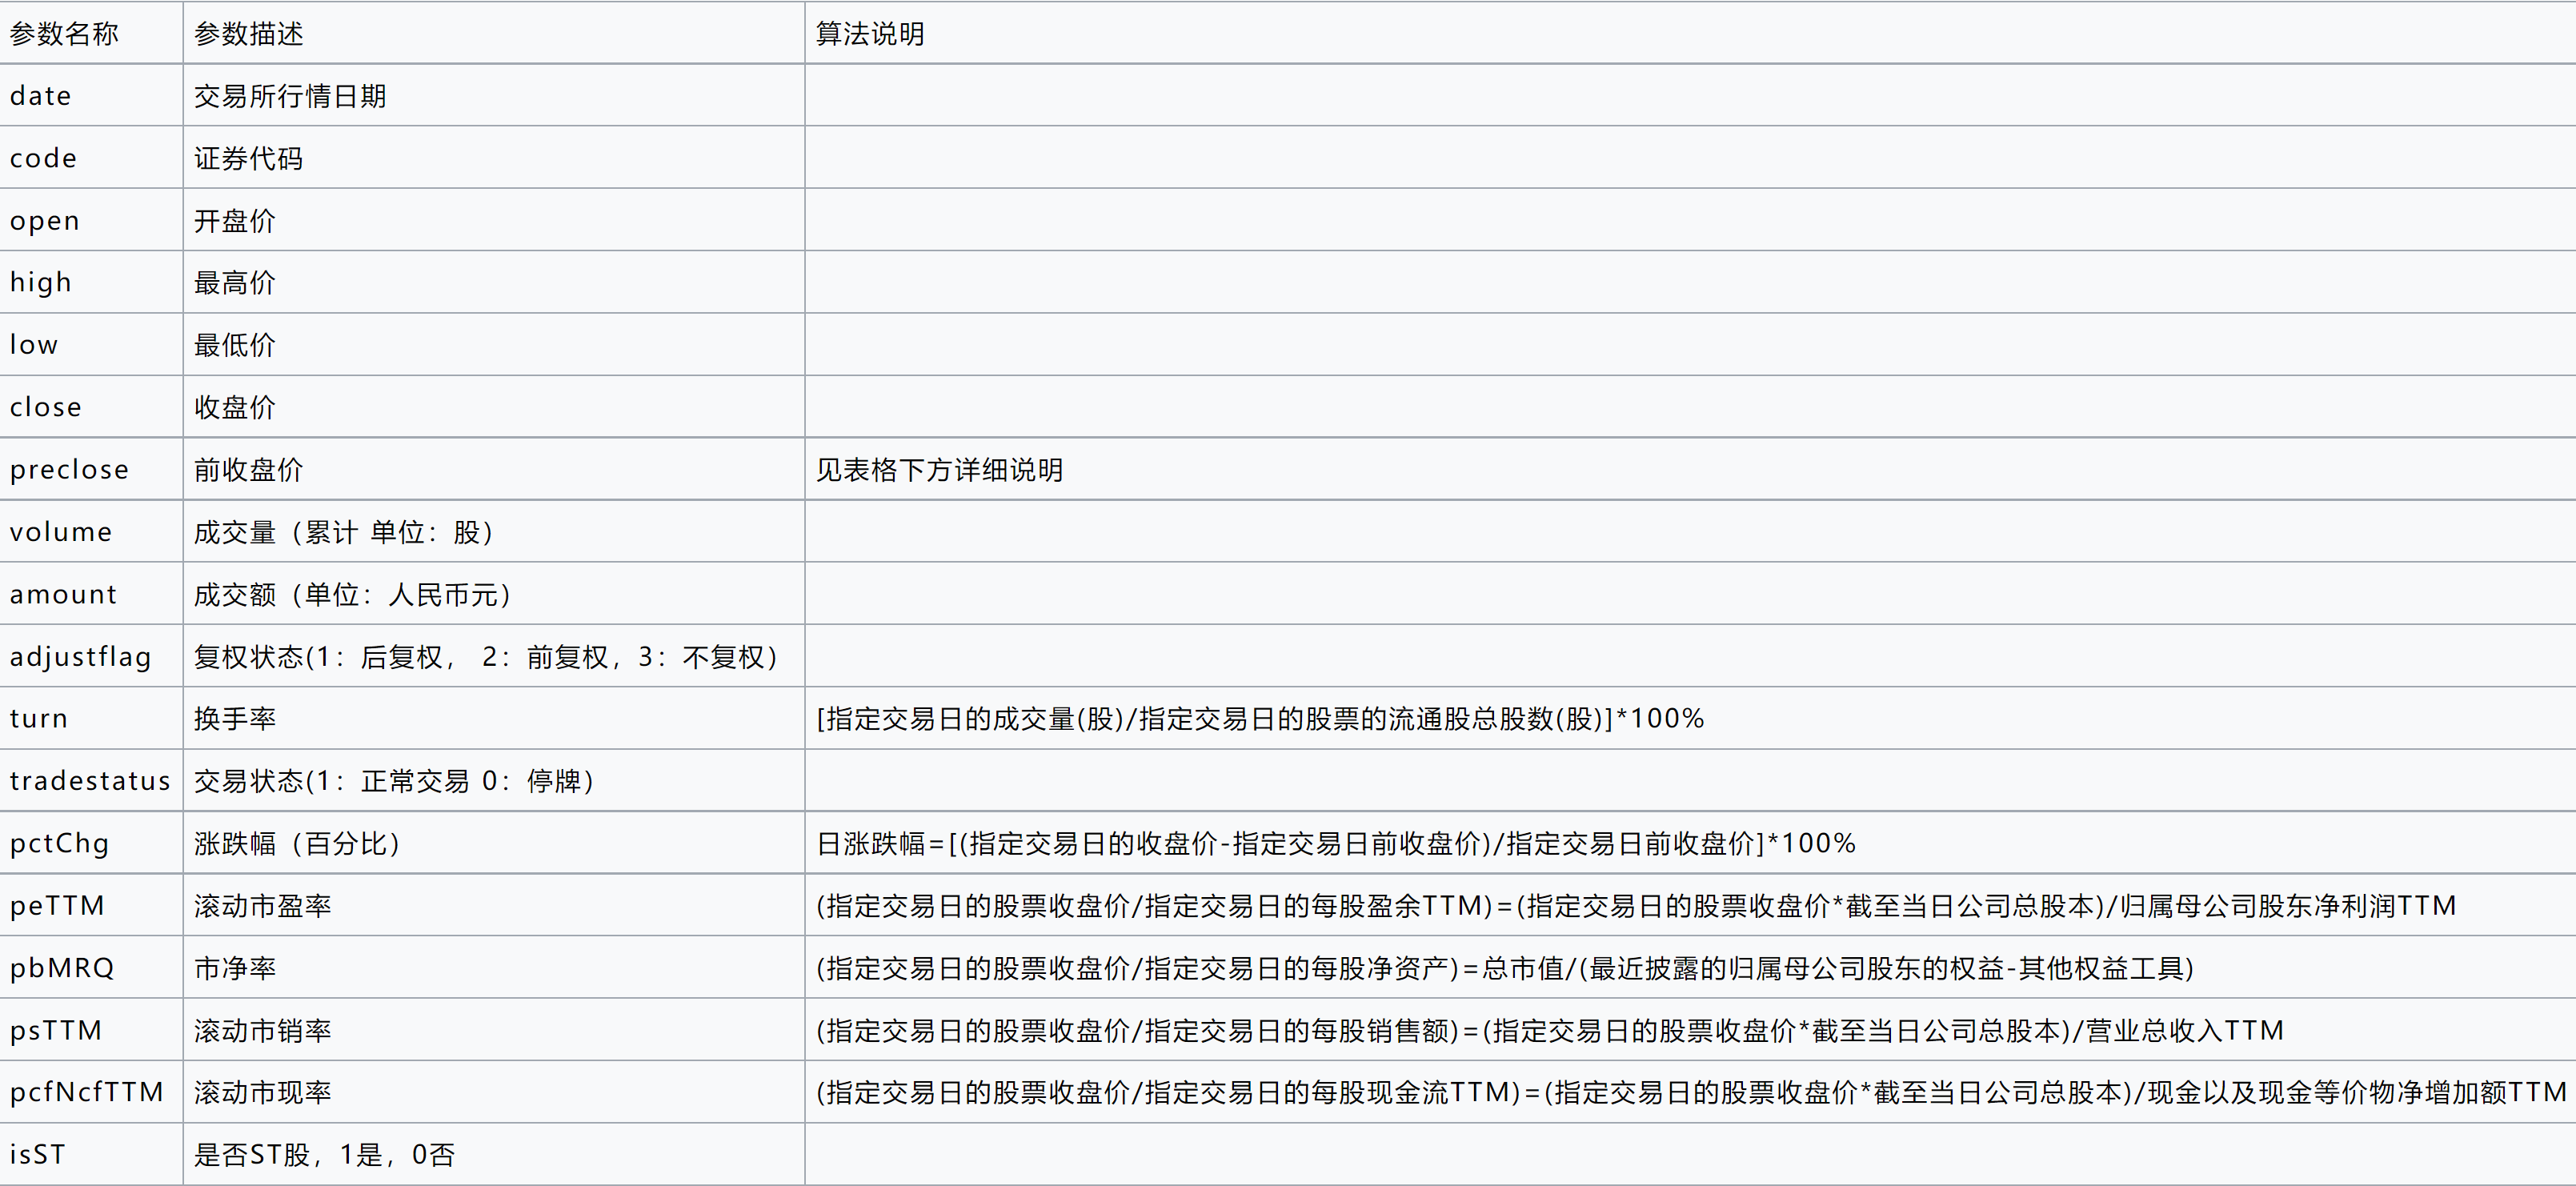
运行结果与参数说明
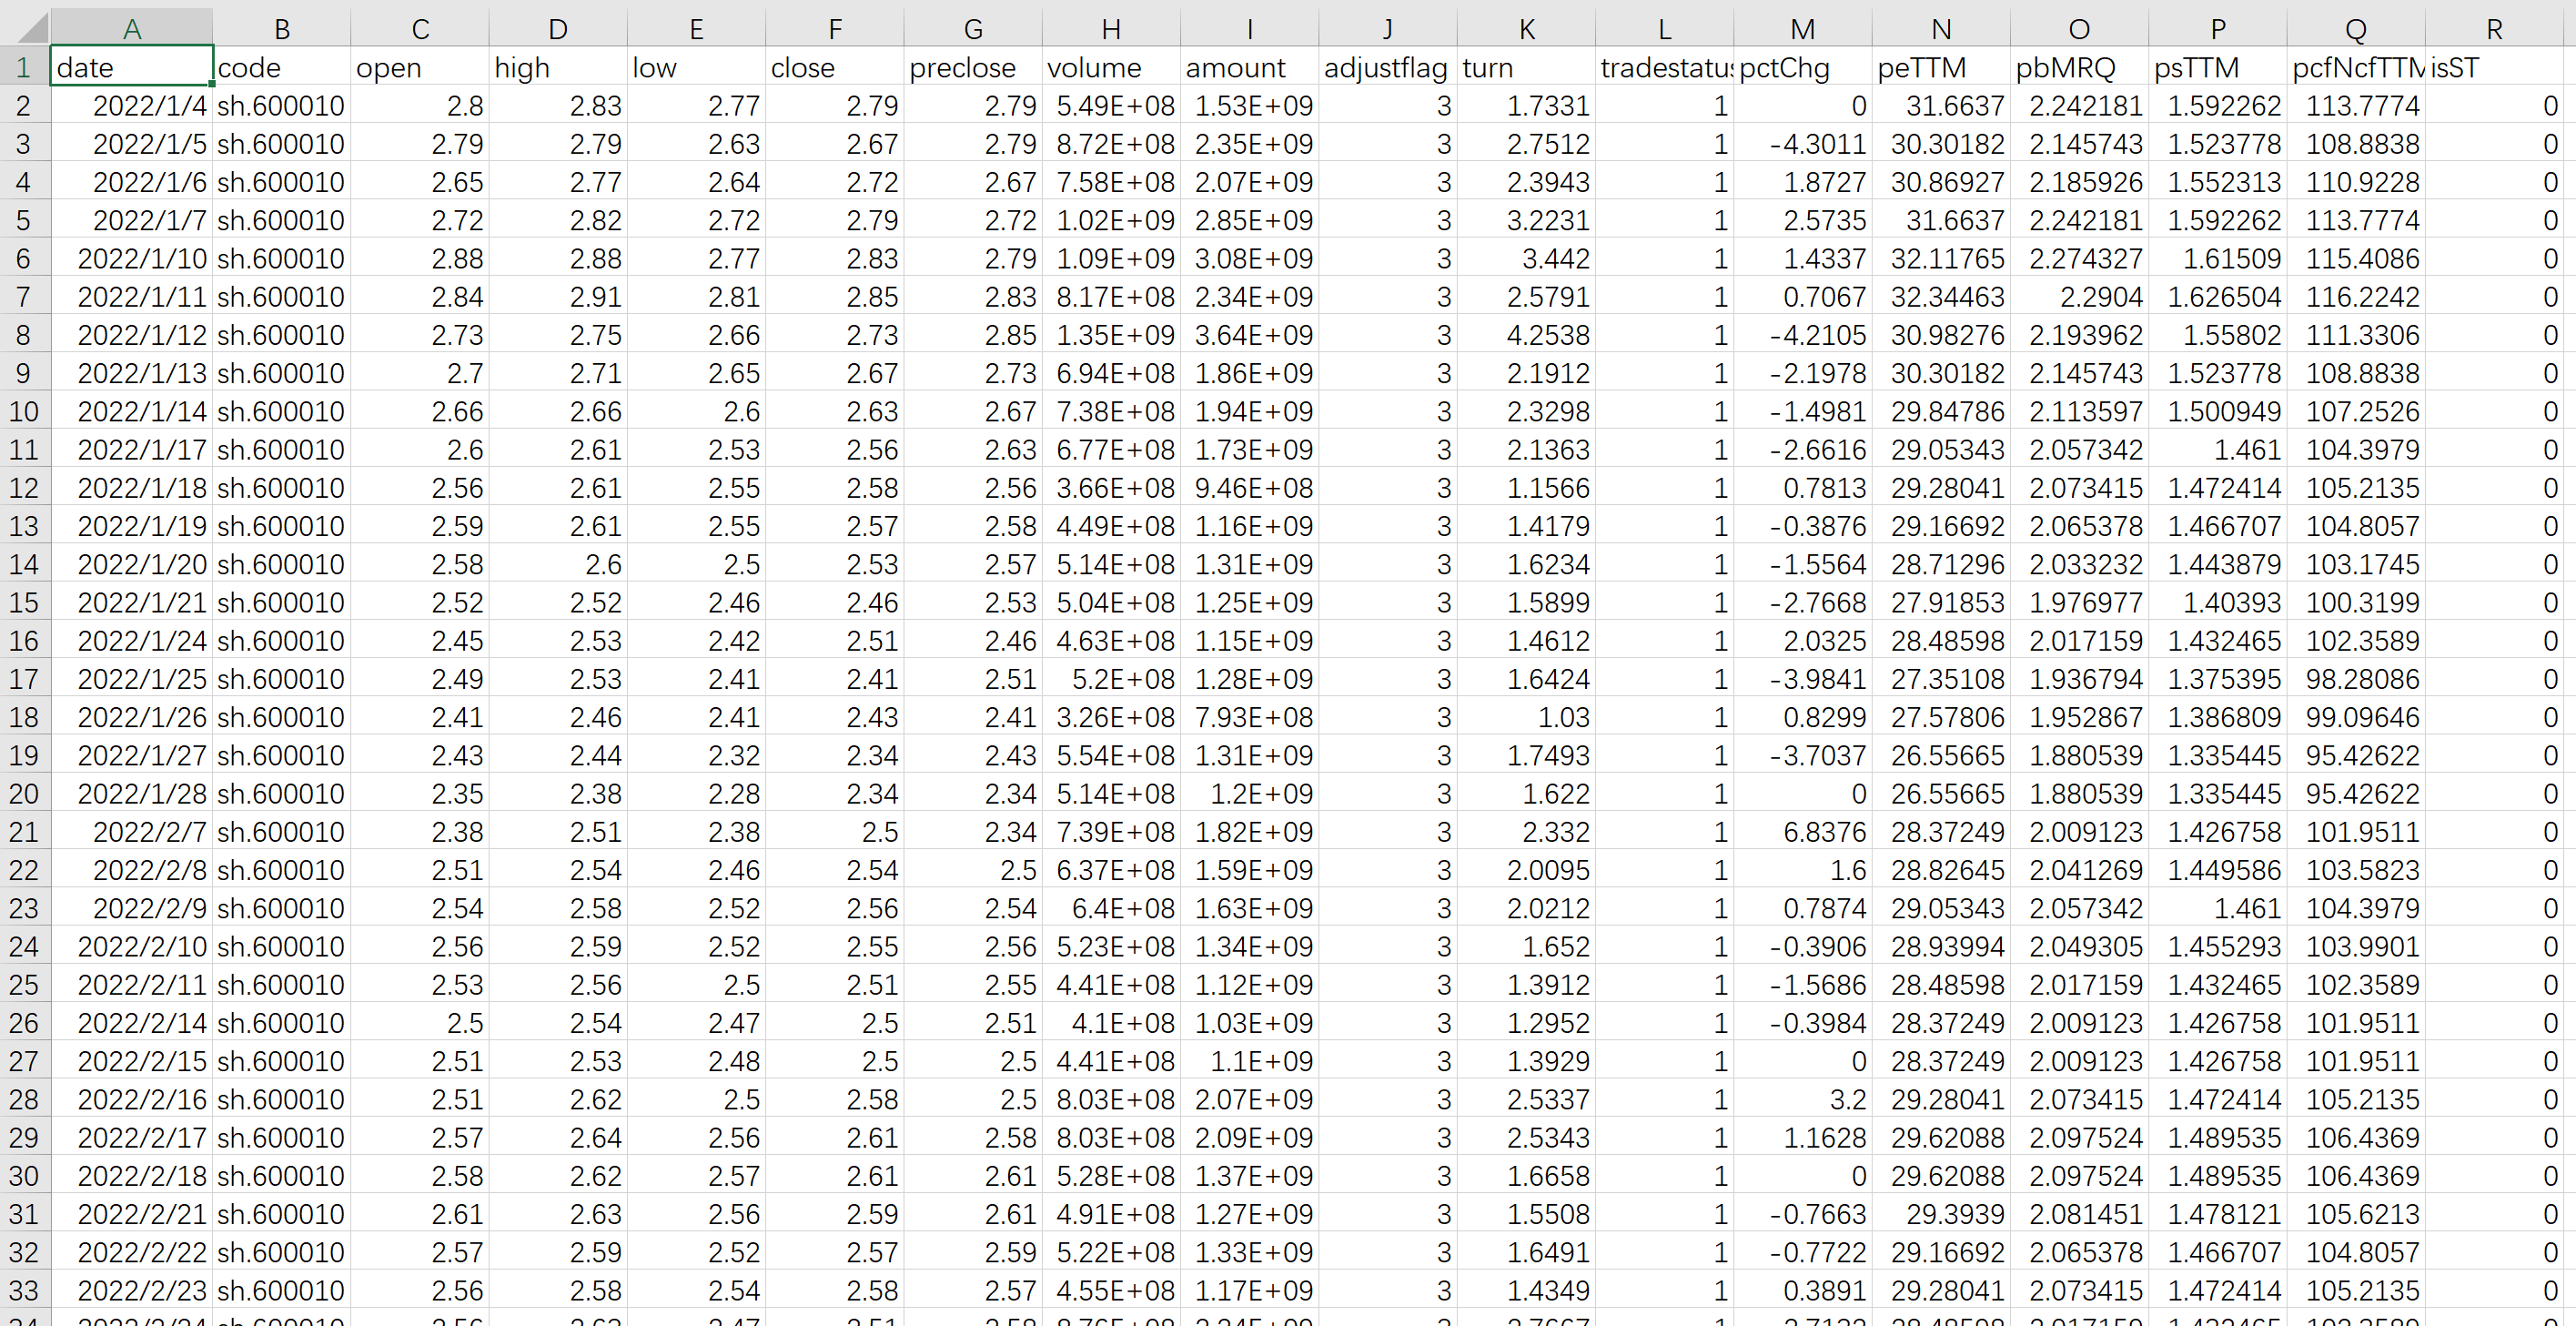
使用sh.600010做尝试,结果如下


